Driving Decisions With Data Dashboards: Tracking Power Plant End-User Efficiencies
Harnessing the power of data throughout the project life cycle
Driving Decisions with Data Dashboards
Across Tetra Tech’s markets, nearly all clients share the need for actionable information that can drive decision making. Big data began bursting onto the scene some 25 years ago, inundating our information-hungry clients with megabytes and gigabytes of facts and figures that soon became a flood of petabytes and zettabytes. Managers thirsty for relevant intelligence were drowning in oceans of data, wondering what was important, what was essential, and what was urgent information.
In response to the need for timely and relevant information that can be analyzed, Tetra Tech employees from many facets of engineering, science, and technology began to apply methodologies to identify, analyze, and report mission-critical information. This article explores some of the ways we are Leading with Science® by using innovative data analytics techniques and digital dashboards—tools that integrate, display, and analyze key data—to help our clients gain insights that allow them to improve customer service and efficiency, make decisions in real time, and even use predictive analytics to steer toward the best future outcome.
Tracking power plant end-user efficiencies
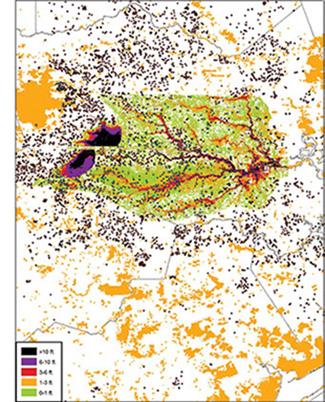
Tetra Tech’s broad portfolio of data visualization services extends into the energy market, where the company supports innovative wind, solar, geothermal, and conventional power projects. Tetra Tech Project Manager, Lark Lee, and Energy Data Management Specialist, Dan Belknap, help the Public Utility Commission of Texas (PUCT) evaluate energy efficiency initiatives for the state’s nine public utilities.
“Texas requires that public utilities report data related to reductions in energy consumption, peak demand for power, and other parameters,” said Lark. “We work with the utilities to collect that data, so PUCT can have a consolidated view of energy efficiency programs across the state.
“We see the full range of results of what is happening at the facilities served by the power companies,” Lark said. “A lot of it relates to equipment such as HVAC units, lighting, and refrigeration. Significant advancements in efficiency show up in the data.”
“The project has generated more than 1 million records over the past 5 years,” said Dan. “That is a lot to process. We have automated as much as possible to reduce labor and improve accuracy. The goal is to provide PUCT with the information they need to verify utilities’ progress towards their annual goals. We produce data visualization tools and provide follow-up verification through phone surveys, on-site visits, and regular communication with utilities.”
The group collects, analyzes, and reports the data through several software and processing vehicles. “In cases without direct metering, we conduct energy use estimates via engineering software and other calculations,” Dan said. The team also uses MS Excel for simple analyses and MS SQL Server for more complex data analytics. Dashboard displays are based in part on MS Power BI tools. They also work in Esri’s ArcGIS for map visualizations and geographic analysis and use R software for statistical computing and graphics.
Lark and Dan are part of a core of Tetra Tech professionals, led by Bonnie Brandreth, who are pioneering data-driven decision-making support through market research, data modeling, and statistical analysis. “We have been doing this for the energy sector and other clients for a long time, starting in the 1980s,” Bonnie said. “Now, some states have hard targets for energy reductions to help avoid or delay construction of new power plants, reduce carbon footprints, and support low-income energy programs and for other purposes.
“We have evaluated more than 500 energy efficiency programs across the United States over the past 30 years,” Bonnie added. “The demand for analytical services is greater than ever. Clients recognize the power of data analytics in solving real-world business problems, but the process can be intimidating. We give them a way to visualize that information and make decision-making easier.”
Read more about data analytics in the energy sector in our interview with Bonnie at tetratech.com/experts.
The volume of data generated in our industry grows every day. Our challenge is to sift through vast data sets, identify critical information needed to make meaningful decisions, and present that information in a simplified, usable format. Throughout its markets—from disaster recovery to water, environment, energy, aviation, and beyond—Tetra Tech helps clients harness the power of their data to boost success throughout project life cycles.