Lane Jost is a manager on the PwC CR team where in addition to collaborating with his colleagues to optimize the team’s use of data, he is the operations leader of the PwC Charitable Foundation.
According to the Global Reporting Initiative (GRI), by the end of 2011, 95% of the world’s 250 largest firms were disclosing their Corporate Responsibility (CR) or sustainability performance. As CR continues to rise in strategic significance in the US and across the globe, so does the need for leading firms to provide better means to measure and report on their various CR commitments. While the market is clearly trending toward increasing corporate transparency on organizations’ nonfinancial data– both negative and positive – the next step is to see how firms are using such disclosures to better manage their CR performance and create enduring value for all stakeholders – from investors and employees to civil society and to nonprofit groups. Finally, as CR reporting becomes increasingly integrated with financial reporting, CR data quality must be held to a comparable level. This is where both the latest data analytic technology paired with a rigorous control policy come together to align CR measurement with the overall operating core of an organization.
Our CR strategy is powered by three priorities – the engagement of our people, brand enhancement and the pursuit of operational efficiencies – that are directly linked to PwC’s business strategy. The long term strength of our business will rely on how well we respond to five megatrends that are shaping our world, and this is no different for CR and how we use it as a driver for new value. To achieve this, it all starts with a steady stream of data analytic tools.
As a firm of accountants, tax professionals, consultants and problem solvers of every stripe, our culture’s first language is a numerical one. And since CR is a part of who we are as global network, we are extremely focused on leveraging the power of data analytics to raise the awareness of our work and most importantly, to create high performance across all of our focus areas. More simply put, our people can relate to numbers – and it is our responsibility to provide CR data to them with accuracy, consistency and contextual value. So how do we accomplish this?
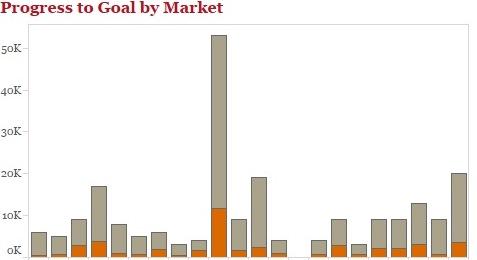
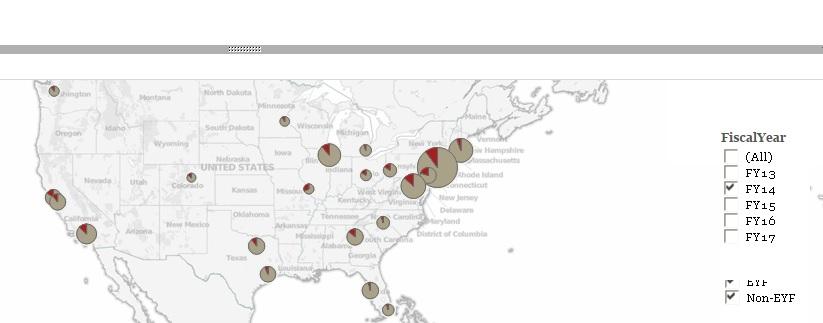
Over the past two years, our CR data team has developed a dashboard that displays more than 25 key performance indicators (KPIs) across all of our commitments and focus areas. The dashboard is a web portal that aggregates and visualizes data from across our enterprise that provides a holistic snapshot of CR performance. We share this dashboard with our key internal stakeholders so they have real time access to gauge how their particular geographic market is performing and can also compare their performance – achievement against volunteer hour targets for instance – against other PwC markets. This real time filtering and analytic capacity provides a hassle-free experience from sharing and viewing myriad Excel files across different time periods. Additionally, this dashboard unleashes the competitive spirit also representative in our culture, as markets and functional teams can compete across the various performance measures displayed. In this case, competition can yield greater social return through the delivery of analytic tools.
Not only do markets revel in their success when they access the updated performance in the dashboard, but more importantly, when targets are not met, they use the information to develop on-the-fly solutions to improve their performance for the next quarter. When data becomes mined and analyzed to inform new actions, that’s when the true potential of a dashboard is achieved. Counting air travel miles, volunteer hours or carbon emissions per full time employee (FTE) has limited value without the addition of context and synthesis. As a colleague once put it: “Capturing data without a plan to triangulate is just like putting your car in neutral and slamming your foot on the accelerator.” We capture and visualize data in order to find ways to measure the elusive return on investment (ROI) of CR.
In a recent discovery, we investigated what sort of a directional relationship CR could have on common human resources KPIs such as retention and tenure. After mining the results, we found that there is indeed a positive relationship between a PwC employee’s engagement with CR and their tenure with the firm. The challenges to measuring the efficacy of CR are both strategically and tactically difficult. And we have not always gotten it right. On the strategy side, CR remains a burgeoning functional area where data is as much about awareness as it is about sophisticated, longitudinal analysis. We have emphasized primary input KPIs, such as volunteer hours and participation rates (%), as they are the closest within our sphere of control and legible to our key stakeholders. However, we are moving toward providing data that, with the right mix of analysis, can continue to measure outcomes in addition to inputs.
Our approach to measurement is constantly evolving as we take on new work streams and improve the front end dashboard user interface, but its purpose never changes: to provide information to improve CR performance across our organization. Knowing where we stand today provides critical clues on how we can improve tomorrow, getting us closer to understanding more specifically how we add quantifiable, credible value to our business and to society at large.