By: Lakshmikanth Mathur, Raajeev Kalyanaraman and Luke Huckaba
Summary
Companies and their executives give importance to sustainability for several reasons. Sustainability initiatives help increase energy efficiency, reduce carbon emissions, and reduce OpEx. Sustainability initiatives also provide a competitive advantage, add brand value, increase sales and create new opportunities. Companywide business units started with physical server consolidation using virtualization technologies from VMware to reduce their carbon emissions significantly. But to achieve zero carbon emissions, customers need insights into the carbon footprint of their virtual IT infrastructure objects.
As of today, the out of the box VMware Aria Operations sustainability dashboards do not have the following visual representation:
- Carbon emissions of virtual infrastructure objects with drill-down capability from vCenter all the way down to an individual virtual machine.
This blog post details a new carbon emissions explorer dashboard for VMware Aria Operations that allows customers to:
- Explore carbon emissions at various virtual infrastructure object levels in one page with drill-down capability from vCenter all the way down to an individual virtual machine.
- Quickly identify and take actions on outliers to reduce carbon footprint.
- Gain insights into opportunities for right-sizing over-provisioned clusters and over-sized VMs based on their carbon emissions.
Armed with this information, customers can take actions to reduce their IT infrastructure’s carbon footprint.
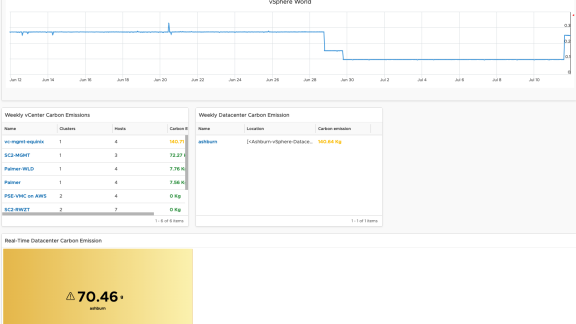
Carbon Emissions Explorer Dashboard
The carbon emissions explorer dashboard described in this blog uses out of the box metrics, Super Metrics and new widgets/views. This dashboard provides the following insights about the customer’s IT infrastructure:
- Trend of their overall carbon emission and their journey in reducing carbon footprint.
- Near real-time carbon emissions by their IT datacenters.
- Aggregated weekly carbon emissions by vCenter, datacenter, cluster, host and individual VMs.
- Top 10 clusters by highest and lowest power consumption.
- Identification of oversized clusters from which physical hosts can be removed to reduce carbon footprint.
- Identification of oversized VMs which can be resized to reduce carbon footprint.
Conclusion
The new carbon emissions explorer dashboard in VMware Aria Operations is a significant step towards achieving zero carbon emissions in IT infrastructure. By providing customers with detailed insights into their carbon footprint at various levels, from vCenter down to individual virtual machines, the dashboard empowers companies to make informed decisions and take targeted actions to reduce their environmental impact. The dashboard offers a range of valuable features, including real-time trend analysis of carbon emissions, visibility into datacenters’ carbon footprint, identification of top-performing and underperforming clusters based on power consumption, and the ability to quickly identify and right-size oversized virtual machines and clusters. These features are made possible through the integration of out-of-the-box metrics, custom Super Metrics, and customizable widgets/views.
With VMware Aria Operations and its powerful dashboarding capabilities, customers can track their progress in reducing their carbon footprint and continuously refine their sustainability efforts. By enabling transparency, actionable insights, and the ability to make data-driven decisions, this dashboard supports companies in their journey towards a greener future.
Free Trial!
Sign up for a free trial of VMware Aria Operations and deploy this dashboard in your environment to gain helpful insights and possible cost savings through power reduction while simultaneously reducing carbon emissions.
Additional Resources
- This dashboard can be downloaded from the developer exchange. All included assets are bundled in and can be installed in the customer environment. The developer exchange page also provides detailed installation instructions.
- There is also a short video that goes over the carbon emissions explorer dashboard – the video can be accessed at the following link
To find out more about the Carbon Emissions Explorer Dashboard check out the walkthrough here.