Duke Energy’s plans to manage solar energy worked as expected, but people caused one surprise

Instead of watching the Great American Eclipse on Monday, Duke Energy grid operators were watching the grid. For the most part, everything went as expected when the moon created a dusk-like darkness over North Carolina’s solar panels.
Some cloudy skies and manual adjustments to solar energy flowing to the grid reduced the amount of solar energy produced before the eclipse started, said Sammy Roberts, Duke Energy director of system operations. Originally, Duke Energy estimated production would drop from about 2,500 megawatts to 200 megawatts in 90 minutes, but because of clouds, it is estimated that solar output would have dropped from about 1,808 megawatts to 109 megawatts at the height of the eclipse without manual adjustments to the solar output.
As planned, flexible fuel sources like natural gas plants were used to fill the void.
Surprisingly, rather than seeing an increase in energy demand as streetlights switched on, Duke Energy’s grid saw a reduction in energy use as millions ran outside to catch a glimpse of the stunning phenomenon. Energy use dropped about 1770 megawatts just before the eclipse as shown by the green line on the graph below.
For months, Duke Energy prepared. The eclipse took place from about 1 p.m. to 3 p.m., normally a peak time for solar energy production.
The drastic drop-off caused by the eclipse was a balancing act for utilities because energy supply to the grid must match customer demand at any moment. But because Duke Energy has a diverse mix of energy sources and a plan, it was able to keep the lights on.
The Aug. 21 eclipse was a first-of-its-kind in the solar energy industry. The last total solar eclipse in the United States was in 1991, before solar energy was an integral part of the nation’s energy portfolio. Solar installations have grown by an average of 68 percent each year, according to the Solar Energy Industries Association, in the last decade alone.
More growth is expected as technology advances and prices drop, so this eclipse was an opportunity to gather data that will help inform decisions as more solar energy is installed.
Researchers at the Electric Power Research Institute (EPRI), spent Monday monitoring solar energy production across the country, including a Duke Energy solar plant in La Grange, N.C. Ben York, leader of the EPRI study (to be released the week of Sept. 4), and his team tracked solar energy output and the amount of light let into the panels during the eclipse obscurity.
The results will help the industry understand what to expect during an eclipse, including how much energy will be lost, how fast it will come back, the difference between being in or outside the path of totality and how it compares to everyday events like thunderstorms.
“The better understanding you have of the resources, the more confident you can be in your projections,” York said. “The more data we’re able to collect and the more we can improve forecasting, the more cost effectively we can get through these events.”
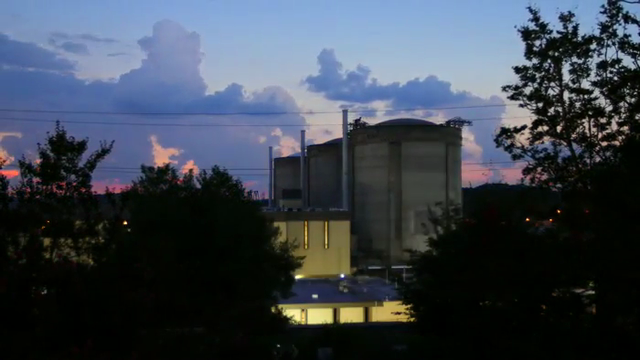
The video above is a 15-second time-lapse was taken during the eclipse at Oconee Nuclear Station in Seneca, S.C. The World of Energy at Oconee hosted events including a watch party on its lawn. An exhibit of eclipse-inspired art is on view at the World of Energy.