Harnessing the power of data throughout the project life cycle
Across Tetra Tech’s markets, nearly all clients share the need for actionable information that can drive decision making. Big data began bursting onto the scene some 25 years ago, inundating our information-hungry clients with megabytes and gigabytes of facts and figures that soon became a flood of petabytes and zettabytes. Managers thirsty for relevant intelligence were drowning in oceans of data, wondering what was important, what was essential, and what was urgent information.
In response to the need for timely and relevant information that can be analyzed, Tetra Tech employees from many facets of engineering, science, and technology began to apply methodologies to identify, analyze, and report mission-critical information. This article explores some of the ways we are Leading with Science® by using innovative data analytics techniques and digital dashboards—tools that integrate, display, and analyze key data—to help our clients gain insights that allow them to improve customer service and efficiency, make decisions in real time, and even use predictive analytics to steer toward the best future outcome.
Using 3-D data visualization in aviation and beyond
Tetra Tech’s recent acquisition, BridgeNet, A Tetra Tech Company, uses a combination of 3-dimensional (3-D) visualization and user-friendly dashboards to help technical and nontechnical audiences make decisions regarding airport operations. BridgeNet developed Volans, an innovative, proprietary 3-D airspace visualization software tool to analyze and display airspace data and procedures that can analyze environmental and operational efficiency to determine benefits and risks associated with new flight procedure development.
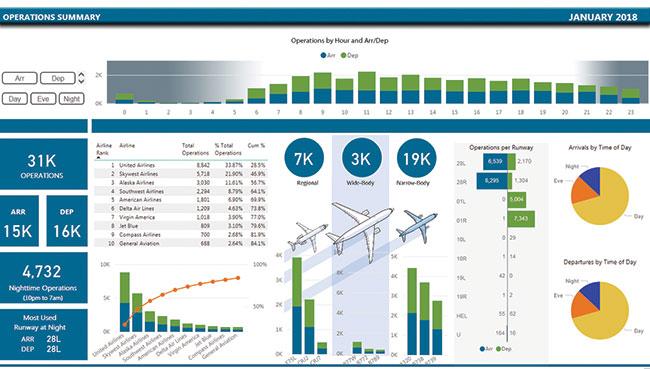
BridgeNet is working closely with one of the country’s busiest airports to assess its operations, documenting number and types of aircraft, departures and arrival times, and overall volume of aircraft using the airport. Tetra Tech’s data analytics experts create dashboards using MS Power BI, which integrates data seamlessly and displays the information in real time.
Clients for this easy-to-use, responsive, and functionally rich data visualization tool include the U.S. Federal Aviation Administration; Air Navigation Service Providers in Canada, Australia, and France; and major U.S. and international airports.
The volume of data generated in our industry grows every day. Our challenge is to sift through vast data sets, identify critical information needed to make meaningful decisions, and present that information in a simplified, usable format. Throughout its markets—from disaster recovery to water, environment, energy, aviation, and beyond—Tetra Tech helps clients harness the power of their data to boost success throughout project life cycles.