Cascale’s Member Analytics Portal (MAP) makes data-driven reporting accessible, visible, and engaging.
Information wants to be free.
But too often it ends up locked away behind opaque reporting systems, busy experts, and data stores that won’t cooperate with each other. When that means I can’t get my bike computer to read my heart rate from my watch, that’s annoying, but I’ll live with it. When it means that our industry doesn’t have the reporting it needs to make data informed decisions about addressing supply chain driven climate impacts that’s a problem Cascale needs to solve.
Cascale’s Member Analytics Portal (MAP) is a member-only dashboard that provides aggregated, anonymized insights from Higg Index data. It frees Higg Index data and makes it easy to act on internally. With a user-friendly interface that enables fast exploration and even custom report building, all Cascale Corporate members can feel confident to internally analyze, measure, and act upon their Higg Index data.
Why now? Anyone attending my data sessions in years past at the Annual Meeting will recall that the MAP was soft-launched to select members in November 2023, and shared more broadly among members in April 2024. Over those years we’ve received a lot of member feedback, much of it positive, some of it negative, but all of it kind and useful and we’ve been able to take member experiences with the MAP to create a reporting platform that shines across a broad set of member use cases:
Pinpoint hotspots. Compare sustainability performance data. Access gaps in Scope 3 reporting. Compare facility data. Export it all into one easy downloadable Excel report. The MAP unlocks data strides for our industry.
How to Use MAP
The MAP provides value for Environmental, Social, and Governance (ESG) reporting by tracking progress across sustainability initiatives, and delivers valuable Higg Index data insights to industry stakeholders.
The use cases are immediate. With MAP, Corporate members can:
- Highlight high-impact hotspots in the supply chain
- Compare sustainability performance to industry averages through Higg Facility Environmental Module (Higg FEM) and Higg Brand & Retail Module (Higg BRM) data
- Complete data gaps for Scope 3 environmental reporting
- Compare facility data
- Access and download results from each view to integrate with Higg FEM data in Excel.
- MAP offers a range of views, including Higg BRM benchmarking, Higg FEM energy and water data to help members analyze performance and track sustainability progress.
During testing, one Cascale member cited MAP’s ease of access and pointed toward the ability to at some point enable better conversations between vendors. Another member noted how MAP was not only “fun” but “immensely helpful.”
It’s available now to explore for Cascale Corporate members, but before diving into the data, there are a few helpful points for members to keep in mind.
How NOT to Use Map
This data is meant for Cascale Corporate member companies to utilize internally and act upon however their sustainability journey merits! It is not meant to be shared or communicated externally. Once again, MAP cannot be used to make external comparative claims or industry-wide performance assessments.
Remember, Cascale does not – and will not – endorse any member external data claims or verify the accuracy of such analyses. Information may be free but it still requires a responsibility for proper usage.
With the MAP, we believe our members will gain the confidence to proceed confidently in their own data-driven discoveries.
Onward!
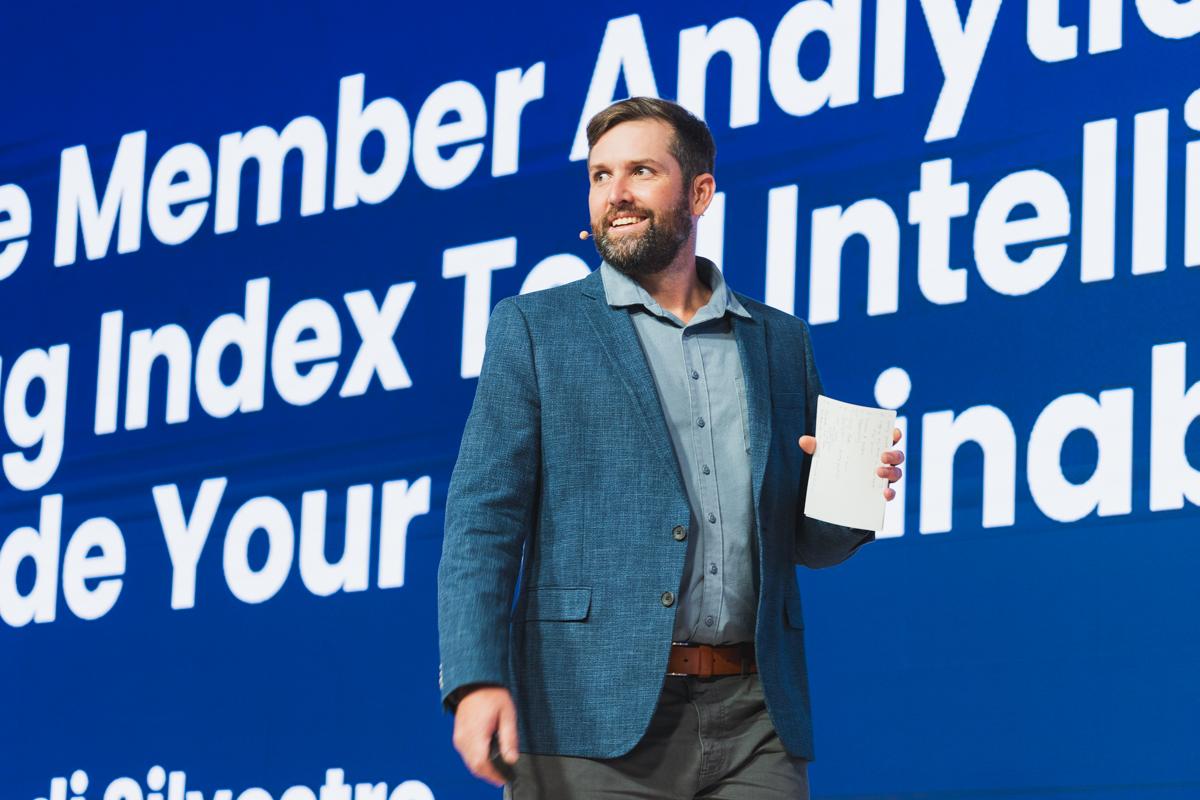
Aaron Di Silvestro is Cascale's senior director, Higg products.