


")
")

Each year we survey our performance in important areas of environmental and social responsibility by monitoring key metrics for fiber, emissions, energy usage and the impact of our operations on air, water and solid waste. We use this data to set improvement goals for our operations and interactions with key stakeholders.
Energy
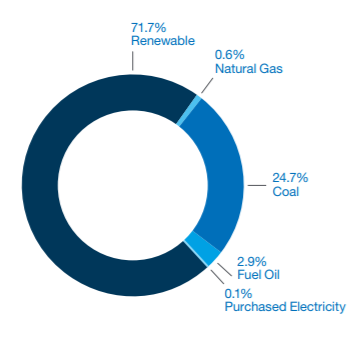
Renewable energy continues to be the dominant source of energy at our three mills as indicated in the three pie charts. In 2018, our total onsite renewable energy use consisted of Black Liquor, 60.7 percent; Biomass, 38.1 percent; and Sludge, 1.2 percent. The bar chart shows the percent of renewable energy for the last five years for comparison purposes. Purchased electricity also includes a renewable contribution and we benefit from the commitments of our regions to increase the amount of renewable energy in the market.
Other sources of energy are comprised of alternative fuels and fossil fuels. Both are noted on the pie charts. Alternative fuels (waste that rather than being landfilled or disposed of are repurposed) are also noted on the pie graph and include Tire Derived Fuel (TDF), Waste Oil, and Construction and Demolition Debris. Fossil fuels predominantly include the use of natural gas, but also some coal and fuel oil.
In order to monitor our commitments to energy efficiency, we track Energy Intensity, as illustrated in the bar chart. We define Energy Intensity as the total energy consumed to produce a set unit of product. Total energy is measured in gigajoules and is determined by fuel use and corresponding records. Unit of product is measured in air-dried metric tons (admt) and is the saleable product manufactured during the year, including market pulp. In order to achieve our current five-year goal to reduce energy consumption per ton of product by 5 percent, operators manage fuel usage in the steam and power generation systems at each of our mills to optimize production and cost efficiencies. Energy intensity for 2018 was negatively impacted by the rebuild of Paper Machine 1 (PM1) at Somerset.
Read more from Sappi North America's 2018 Sustainability Report here: tiny.cc/SappiNA_SR18