From Ash Pond To Riverside Wetlands: Making the Business Case for Engineered Natural Technologies
Originally published in ScienceDirect
Abstract
The 2015 announcement of The Dow Chemical Company's (Dow) Valuing Nature Goal, which aims to identify $1 billion in business value from projects that are better for nature, gives nature a spot at the project design table. To support this goal, Dow and The Nature Conservancy have extended their long-standing collaboration and are now working to develop a defensible methodology to support the implementation of the goal. This paper reviews the nature valuation methodology framework developed by the Collaboration in support of the goal. The nature valuation methodology is a three-step process that engages Dow project managers at multiple stages in the project design and capital allocation processes. The three-step process identifies projects that may have a large impact on nature and then promotes the use of ecosystem service tools, such as the Ecosystem Services Identification and Inventory Tool, to enhance the project design so that it better supports ecosystem health. After reviewing the nature valuation methodology, we describe the results from a case study of redevelopment plans for a 23-acre site adjacent to Dow's Michigan Operations plant along the Tittabawassee River.
1. Introduction
As part of The Dow Chemical Company's (“Dow's”) 2025 sustainability goals, nature now has a spot at the design table and a critical role in business decisions. Dow's Valuing Nature Goal aims to identify $1 billion in long-term value from projects necessary for its businesses that are also better for nature than traditional alternatives. The foundation for this goal was based on a study that investigated the use of the replacement cost methodology (RCM) for financial analysis and life cycle assessment (LCA) for environmental assessment comparing grey and green infrastructure solutions for wastewater treatment in Seadrift, Texas (DiMuro et al., 2014).
Green infrastructure is a concept originating in the US in the mid-1990s that highlights the importance of the natural environment in decisions about land-use planning. The President's Council on Sustainable Development initiated efforts to apply the concept of sustainable development in the US and identified green infrastructure as one of several key strategies for achieving sustainability in its May 1999 report. The report, titled “Towards a Sustainable America – Advancing Prosperity, Opportunity and a Healthy Environment for the 21st Century” defined green infrastructure as: “the network of open space, airsheds, woodlands, wildlife habitat, parks and other natural areas that provide many vital services that sustain life and enrich the quality of life” (The President's Council on Sustainable Development, 1999, p. 64).
However, the term does not have a widely recognized definition, and mostly refers to a network of protected sites, nature reserves, green spaces, and greenway linkages. The Nature Team decided this term did not fit its intentions, i.e., the creation of a network between Dow manufacturing sites and the local ecosystem may be totally absent and even undesirable in some cases from our objectives. Dow extended the concept of green infrastructure to include solutions that were applicable to manufacturing site challenges. The term Dow uses is “engineered natural technologies,” referred to as ENT, and defined as “engineered systems that use or mimic natural processes and are able to deliver the same design functionality as a man-made solution while affording benefits to the triple bottom line.” ENT may also involve protection and restoration of natural systems, but it is more expansive and includes much more than just protection and restoration of nature. The term “natural infrastructure” more accurately refers to projects that solely aim to protect and restore nature.
This paper reviews the framework and methodology developed by the Nature Team to engage Dow employees in defining, at the initial stages of projects and product design, opportunities for driving business value associated with the benefits obtained from nature's functions, commonly referred to as ecosystem services. We refer to this methodology as the nature valuation methodology. We then present results from applying this methodology to a specific case study of redevelopment plans for a 23-acre site adjacent to Dow's Michigan Operations plant along the Tittabawassee River, now dubbed the “Dow Riverside Wetlands”.
2. Methods
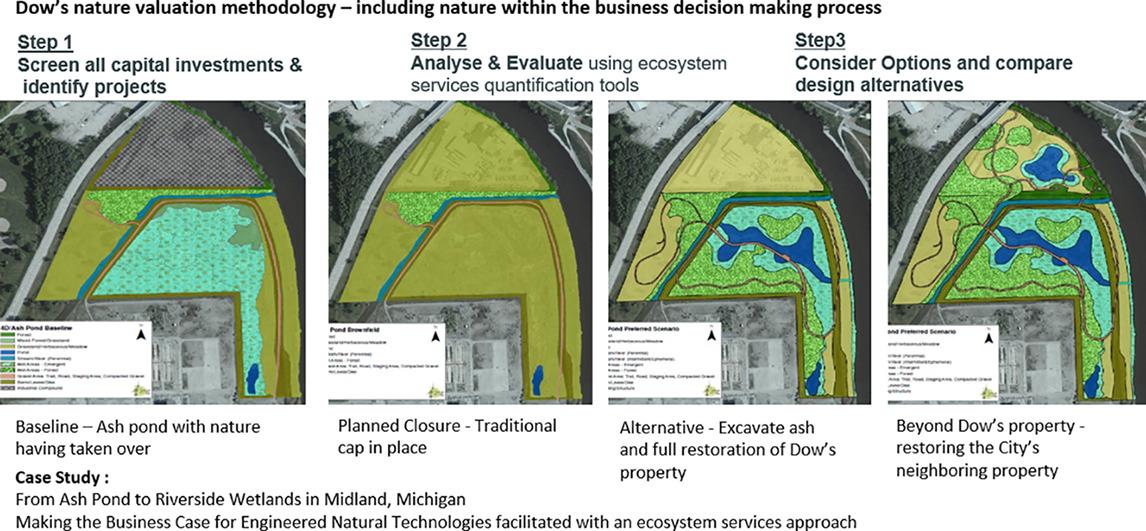
The nature valuation methodology developed to support Dow's Valuing Nature Goal is a tiered process that incorporates the following three steps: i) an initial screen to identify potential opportunities at a very early stage of a project; ii) a subsequent analysis to identify and evaluate potential natural enhancement and engineered natural technology alternatives. This analysis may use a specialized modeling tool owned by The Nature Conservancy (the Conservancy), called the Ecosystem Services Identification and Inventory Tool (ESII Tool) developed in conjunction with Dow and EcoMetrix Solutions Group (ESG) and iii) a final step that considers and compares the financial and natural capital returns associated with the various alternatives. Fig. 1 depicts the nature valuation methodology.
Fig. 1. Three steps of the nature valuation methodology.
The nature valuation methodology is administered and supported by the Nature Team, which consists of employees from both Dow and the Conservancy. The Nature Team reports to Dow's Valuing Nature Goal leaders and executive sponsors and supports the advancement of the Valuing Nature Goal across the company. Within Dow, the Nature Team consists of a project manager and engineers within the Global Environmental Technology Center and Engineering Solutions Group. Within the Conservancy, the Nature Team consists of members from the Corporate Engagement team as well as The Center for Sustainability Science.
The aim of the nature valuation methodology is to provide a framework through which Dow employees, who are typically not well versed in ecology and conservation science, can obtain additional information about the environmental impacts of their proposed processes, strategies, and decisions. By incorporating this information into project design, Dow employees will be able to make better decisions about project design related to environmental impacts. It will also build awareness of the value and benefits of nature across Dow sites and beyond.
The entire nature valuation methodology is structured around a definition of nature that highlights the provisioning of ecosystem services that directly address the large environmental challenges most directly connected to Dow's business operations. Ecosystem services refer to the tangible benefits that humans (and businesses) obtain from ecosystems, which the Millenium Ecosystem Assessment defines as “a dynamic complex of plant, animal, and microorganism communities and the nonliving environment interacting as a functional unit” (Millenium Ecosystem Assessment, 2005, p. v). The nature valuation methodology focuses on the provisioning of three specific ecosystem services: (i) clean water; (ii) clean air; and (iii) healthy soil.
While these three ecosystem services are important, the overall functioning of the local ecosystem is a product of a complex system that includes “inputs, outputs, cycling of materials and energy, and the interactions of organisms” (Christensen et al., 1996, p. 666). To account for the overall functioning of the local environment, the nature valuation methodology also incorporates easy to collect metrics around biodiversity.
In what follows, we detail each of the three nature valuation steps shown in Fig. 1.
2.1. Screen and identify
First, a project goes through an initial five-question screen to identify the potential avenues for environmental impact (e.g., through consumption, emissions, or built footprint) as well as potential opportunities for improving the performance of ecosystem services (e.g., through incorporating natural infrastructure into the project design). Project managers at Dow complete this initial screen during routine, required business processes and it is designed to take only a few minutes to complete. The screen flags potential projects at Dow that are predicted to have significant environmental impacts and that may be counted towards Dow's Valuing Nature Goal. Second, the screen identifies if the project has an impact on clean air, clean water, or healthy soil. With this documented knowledge of the likely ecosystem service impact areas, project managers and engineers at Dow are better able to follow-up on the project design to improve its performance.
Table 1 lists the five questions included in the initial screen. The screen is designed to capture projects that have positive or negative environmental impacts. All five of the questions are answered with a simple yes or no response; a project that records a “yes” answer to at least one question will proceed to step two, the analyze and evaluate step.
Table 1. Nature valuation methodology five-question initial screen.
| Ecosystem service impact area | Question | |
|---|---|---|
| (1) | Biodiversity | Will the proposed project incorporate or support biodiversity and/or connect the affected site to adjacent properties? |
| (2) | Clean water | Will the proposed project significantly impact water discharges, fresh water consumption, and/or storm/process water management of the affected site? |
| (3) | Clean air | Will the proposed project significantly impact the consumption of energy and/or other air emissions of the affected site (GHGs and non-GHGs)? |
| (4) | Healthy soil | Will the proposed project impact the land use or land cover of the affected site in such a way that soil health and/or erosion control may be impacted? |
| (5) | Engineered natural technology? | Have you considered engineered natural technology in your proposed project? |
Each of the first four questions asks about the project's potential impact on one of the previously determined environmental impact areas - biodiversity, clean water, clean air, and healthy soil. The fifth and final question asks about the project's potential to incorporate ENT into its design. ENT uses natural or semi-natural areas instead of traditional grey infrastructure solutions to address business needs, such as a wetland for waste water treatment instead of a waste water treatment plant (DiMuro et al., 2014).
If a project passes the initial screen in step one, by answering “yes” to at least one of the five questions, the second step is to analyze and evaluate the project for its environmental impact. A primary component of this second step is to collect quantitative data on a project's environmental impact. With these data in hand, Dow project engineers are able to create alternative designs that increase the relative performance of the proposed project with respect to key ecosystem services.
2.2. Analyze and evaluate
Environmental impact data may be collected from various sources. For example, potential process improvement projects frequently rely on engineering models that measure absolute reductions in air emissions or freshwater use. For potential capital build projects, however, measuring the environmental impact is oftentimes more complicated because these projects typically alter the physical footprint or landscape of the area. Dow, the Conservancy, and ESG developed a specialized tool, the ESII Tool, to allow Dow project managers to easily gather data on the natural area impacted by a potential project. The ESII Tool, which works as a free iPad or desktop application open to the public, can be used to quickly and effectively generate information on the environmental impact of proposed changes to natural areas.1
The ESII Tool measures the environmental impact or proposed land changes through eight specific ecosystem services: (i) water provisioning, (ii) air quality control (nitrogen and particulate removal), (iii) climate regulation (carbon uptake and localized air temperature regulation), (iv) erosion regulation, (v) water quality control (nitrogen and filtration), (vi) water temperature regulation, (vii) water quantity control, and (viii) aesthetics (noise and visual). Dow identified these eight ecosystem services, which were most directly linked to Dow's business value, through extensive webinars and discussions with both Dow and Conservancy staff.2 The ESII Tool allows for direct comparison of the performance of these eight ecosystem services both across project sites and across project design proposals within a site.
The eight ecosystem services included in the ESII Tool are shown in column (A) of Table 2 as well as the components that are measured for each of these ecosystem services (see column (B)). For each of the 13 measured components, the ESII Tool generates a singular data point on the expected percent performance of that component. These percent performance metrics rate how well the designated landscape performs for that measured component, in percentage terms, relative to the highest possible performance for that measured component, across all landscapes. For example, an air particulate removal score of 50% indicates that the current land cover is removing air particulates at 50% of the maximum potential rate for an ecosystem.
Table 2. The ESII tool's ecosystem service measurements.
| Nature scorecard component | Measured component | Unit measurement | |
|---|---|---|---|
| (A) | (B) | (C) | |
| (1) | Water provisioning | Water provisioning | Gallons/foot2; Gallons/map unit |
| (2) | Air quality control | Nitrogen removal | Pounds/acre/year; Pounds/map unit/year |
| Particulate removal | Pounds/acre/year; Pounds/map unit/year |
||
| (3) | Climate regulation | Air temperature regulation | BTU reduction shade (BTU/foot2/hour); BTU reduction shade (BTU/map unit/hour); BTU reduction shade (BTU/foot2/day); BTU reduction shade (BTU/map unit/day) |
| Carbon uptake | No unit of measure | ||
| (4) | Erosion regulation | Erosion regulation | Acres < 35% |
| Erosion regulation - mass wasting | No unit of measure | ||
| (5) | Water quality control | Nitrogen removal | Nitrogen removal - milligrams/liter; Max nitrogen removal - milligrams/liter |
| Water filtration | TSS removal - milligrams/liter; Max TSS removal - milligrams/liter |
||
| (6) | Water temperature regulation | Water temperature regulation | No unit of measure |
| (7) | Water quantity control | Water quantity control | Water quantity runoff - inches across site; Water quantity runoff - gallons/acre; Water quantity runoff - gallons/map unit |
| (8) | Aesthetics | Noise | Noise attenuation - decibels |
| Visual | Visual screening - acres |
Source: The ESII Tool User's Guide, available at http://www.esiitool.com/users-guide/.
The percent performance metrics are advantageous because they allow for a direct comparison of the performance of ecosystem services. That is, if the carbon uptake score was 30% and the water filtration score was 60%, then the user knows that the project site is more effective at providing carbon uptake services than it is at providing water filtration services. Similarly, if the carbon uptake score of one landscape was 30% and the carbon uptake score of an alternative landscape was 60%, then the user knows that the alternative landscape is more effective at providing carbon uptake services.
In addition to the percent performance scores, the ESII Tool generates performance metrics for 20 different specified engineering unit outputs (see column (C) Table 2). These quantitative unit measurements are advantageous because they provide metrics of the project site's ecosystem service performance in engineering-based units that can be easily interpreted by project managers and engineers at Dow. In addition, these unit measurements can be directly compared to the performance of grey infrastructure. For example, a project manager at Dow can compare the pounds of nitrogen removed from water by the landscape with pounds of nitrogen removed by a water filtration plant.
When interpreting the ESII Tool output data, it's important to understand the different underlying factors affecting the percent performance and engineering unit output measures. The percent performance score represents the project site's performance relative to a maximum theoretical potential for that specific measured component. That is, percent performance measures are primarily affected by the landscape attributes, rather than aerial extent. Two sites, one large and another small, which have the same landscape attribute proportions will score the same, despite differences in size. In contrast, the engineering unit of measure outputs represent the absolute performance of the project site and will be affected by the both the aerial extent and its relative performance. Realistically, both landscape attributes and site aerial extent may change for a given project and it is important to understand how these two elements will affect percent performance and unit of measure outputs in order to make the most appropriate use of these data.
In the second step of the nature valuation methodology, analyze and evaluate, the ESII Tool application is used to quickly and easily compare landscape scenarios for a given project. First, a baseline project design is analyzed within the ESII Tool. The baseline scenario typically represents Dow's standard approach under the “business-as-usual” scenario. From there, alternative scenarios are analyzed and assessed to measure their ecosystem service performance relative to the baseline. The aim is to identify the project design that optimizes the site's performance across the eight ecosystem services. After all alternative scenarios have been analyzed, the final step is to incorporate financial metrics and compare scenarios to decide which one offers the most business value to Dow.
2.3. Consider and compare
The third and final step is to compare the financial and environmental returns across the alternative project designs developed in step two. The financial returns refer to traditional discounted cash flow and return on investment analyses that capture upfront capital costs, including construction and materials, and long-term operations and maintenance costs. These costs are estimated over the useful life of the asset, typically 10 or 30 years with some cases of engineered natural systems extending all the way to 50 years.
Environmental returns are assessed using the ESII Tool outputs, along with two additional environmental attributes: biodiversity and community benefits from the project area. Biodiversity is estimated by the acreage of land, water bodies, and rivers or coastlines impacted by the project design. This estimate follows a long-standing body of research in ecology that relates the number of species to land area, often referred to as the species-area curve (F.W. Preston, 1962). Project areas that connect to natural areas are prioritized, as they maximize the contribution to biodiversity. Community access is assessed based on the number of people that are expected to visit the site per year.
Once the project team has all of the financial metrics and environmental metrics in hand, they compare the alternative design scenarios in terms of both projected financial value and environmental returns. The decision on which set of tradeoffs to weigh most heavily, e.g., discounted cash flow vs. climate control vs. community access, is subjective and will depend on the decision maker's priorities. These competing dimensions can be weighed using analytical tools such as multiple criteria decision-making.
In the next section, we discuss the specific application of the nature valuation methodology in a case study describing the closure of an ash pond in Midland, Michigan.
3. Application and results – from ash pond to riverside wetlands
Prior to rolling out the proposed nature valuation methodology, the Nature Team applied it to a project that involved a land use change. The proposed project involved the closure of an ash pond site covering roughly 23 acres at the Midland Operations facility under the Michigan Department of Environmental Quality's oversight. The site was a cooling pond that was built in the late 1940s to cool water from an on-site coal-fired power plant. The impoundment was used as a cooling pond until the 1980s. The site was surrounded by an earthen berm constructed of sand and silt, with approximately 90,000 cubic yards of ash in place and hydraulic connectivity to the adjacent river. Dow's remedial objective for the ash pond site was to eliminate any pathway concerns for compounds with elevated concentrations at the site. The project had a defined closure strategy supported by a cost estimate, which involved a traditional cap in place and long-term maintenance, including groundwater treatment and monitoring.
The ash pond property is adjacent to the Poseyville Riverside project, a 14.5-acre abandoned concrete facility that is owned by the City of Midland, referred to as the 4-D property. The project team decided to include this adjacent area to deliver an overall cohesive restoration plan to help the city. The two projects, taken together, address components of the City's master plan, which calls for beautification along the river and improving community entryways. The restoration of these properties would improve nearly one mile of riverfront across from Downtown Midland, adding recreational amenities to the city and creating an important connection to a vast network of parks, open spaces and trails.
As part of applying the nature valuation methodology to this project, results from each key step of the methodology will be shared and discussed.
3.1. Screen and identify
Results from the project manager's completion of the initial screen are included in Table 3.
Table 3. Results from the initial screen of the Dow Riverside Wetland Project.
| Ecosystem Service Impact Area | Question | Answer | |
|---|---|---|---|
| (1) | Biodiversity | Will the proposed project incorporate or support biodiversity and/or connect the affected site to adjacent properties? | Yes |
| (2) | Clean water | Will the proposed project significantly impact water discharges, fresh water consumption, and/or storm/process water management of the affected site? | Yes |
| (3) | Clean air | Will the proposed project significantly impact the consumption of energy and/or other air emissions of the affected site (GHGs and non-GHGs)? | No |
| (4) | Healthy soil | Will the proposed project impact the land use or land cover of the affected site in such a way that soil health and/or erosion control may be impacted? | Yes |
| (5) | Engineered natural technology? | Have you considered engineered natural technology in your proposed project? | No |
Since at least one of the answers to the initial screen was yes, this project was flagged to proceed to the next step within the nature valuation methodology. The initial screen was successful in being filled out in less than 5 min by the project manager with questions that were relatively simple to answer. Initially, the project team did not consider ENT. The project screened in due to the impact on water, biodiversity, and healthy soil. By going through the methodology, the possibility of ENT was discussed and considered.
3.2. Analyze and evaluate
In this step, the project manager held a discussion with the Nature Team to answer the following business decision question: how can Dow close the ash pond while enhancing ecosystem services to Dow and the community and creating local habitat, for a lesser overall cost to Dow than the option currently defined?
To address this question, the Nature Team proposed to use the ESII Tool. A special task force of experts from the local chapter of the Conservancy and ESG, along with the existing project team was brought to the site to gather the ecological data to establish the baseline conditions of the project area. The team was also asked to use an iterative design process using the ESII Tool to create alternative restoration scenarios. The project manager defined the priority ecosystem services for this site as being water quantity, water quality and aesthetics.
The critical element found while visiting the site was that the baseline conditions (an ash pond overgrown with trees and wetland plants, many of which were invasive species), as depicted in Fig. 2, were already providing significant ecosystem services. This information gave the project team a benchmark that the closure plan needed to deliver an overall performance higher than what was currently being delivered by the site. The project team developed three alternative restoration designs as depicted in Fig. 3: i) standard brownfield restoration (i.e., cap and plant grass) on the ash pond and 4-D property (referred to as SBR); ii) ecological restoration (i.e., excavate ash and associated soil for secured disposal in approved landfill and restore historic forest, prairie, wetland) of the ash pond only, with SBR on the 4-D property (referred to as ER); and iii) ecological restoration on the ash pond and 4-D property (referred to as ER+).
Fig. 2. Baseline conditions.
Fig. 3. Alternative restoration designs.
The key finding of the analysis is that, if Dow and the City of Midland implemented the SBR, the majority of ecosystem services (7 of 13) could actually be lower than in the baseline conditions. In contrast, if ER+ was implemented, the majority of services would be higher than in the baseline (11 of 13). Results are presented as a percent performance relative to a theoretical maximum (Fig. 4) and in absolute terms as engineering units (Table 4).
Fig. 4. Dow Riverside Wetland Project scenario ecosystem service analyses (percent performance).
Table 4. Dow Riverside Wetland Project scenario ecosystem service analyses for priority ecosystem services (units of measurement).
| Ecosystem services (engineering units of measure) | Baseline | Standard brownfield | Ecological restoration (ash pond only) | Ecological restoration (ash pond + 4D) |
|---|---|---|---|---|
| Water quality NOx removal (mg/l) (area weighted average) | 0.20 | 0.13 | 0.15 | 0.15 |
| Max water quality NOx removal (mg/l) (area weighted average) | 0.80 | 0.52 | 0.75 | 0.83 |
| Water quality TSS removal (mg/l) (area weighted average) | 17 | 13 | 11 | 11 |
| Max water quality TSS removal (mg/l) (area weighted average) | 63 | 78 | 69 | 68 |
| Water quantity runoff (inches of runoff across site) | 1.44 | 1.84 | 0.94 | 0.79 |
| Water quantity runoff (gal) | 1,900,000 | 2,400,000 | 1,240,000 | 1,000,000 |
Source: The ESII Tool Case Studies, available at http://www.esiitool.com/case-studies/.
Water quality control (nitrogen removal) is 20 percentage points higher for ER+ than SBR, but similar in level as the baseline. The water quality control (nitrogen removal) function performs best in aquatic habitat types such as wetlands, riparian areas, and to a limited extent streams. In these habitats, regular inundation, accumulation of organic material, and periodic overland flows contribute to processes of denitrification. The baseline condition for the site included large areas of saturation and inundation. The water regime in certain areas of the SBR design is altered to reduce inundation, resulting in considerably fewer saturated or ponded areas. However, the ER+ design includes slightly more area that is saturated or inundated, and as expected, the ESII Tool results indicate slightly improved performance from that alternative.
In contrast, water filtration (sediment or total suspended solid (TSS) removal) is almost 10 percentage points lower in ER+ than in SBR. Filtration of sediments by plants and infiltration of water into soils are two ecological functions that affect the water filtration model and these results. The high basal cover and density associated with grasses under the SBR design, as opposed to more sparse trees under ER+, enhances filtration. At the same time, more water is expected to infiltrate directly into soils under SBR because more of the area is dry land as opposed to open water. The ER+ design results presume the restoration successfully establishes the desired water regime with identified saturation and inundation levels.
Water quantity control is 30 percentage points higher for ER+ than SBR. This modeling outcome aligns with expectations. Within the ESII Tool, water quantity control is a measure of the landscape's ability to adequately manage and convey a 25-year storm event. This service includes elements that predict the management of precipitation through interception (e.g., canopy cover), infiltration (due to basal ground cover, soil composition, slope, etc.), and water storage (depressional areas ≥ 6 in. deep). The SBR design reduced potential storage for storm events through filling much of the ash pond. In contrast, the ER+ scenario increased storage potential slightly above baseline. SBR also retained some impermeable areas, which reduces the potential for infiltration, and water storage.
Noise and visual aesthetics are 40 and 30 percentage points higher, respectively, under ER+ than SBR. Modeling of noise aesthetic ecosystem services accounts for the ability of vegetation to absorb sound while the modeling of visual aesthetics ecosystem services accounts for the ability of vegetation to screen points on the site from viewers off site. As a result, trees in the forested wetlands and riparian buffer enhance noise attenuation and visual screening in ER+ more than the grasses in SBR. The model of aesthetic services, however, does not consider different attributes of the landscape that may be more or less visually appealing to different viewers. This means that if, for example, some viewers preferred landscaped grasses to natural wetlands, the model results would not reflect the aesthetic benefits that those viewers receive from the different design scenarios.
Step two of the nature valuation methodology suggests that using an ecosystem services modeling process such as the ESII Tool helps facilitate and improve restoration designs through iterative design and understanding of local habitat potential. Modeling results show that the ER and ER+ designs largely met the goals of enhancing water quality control, water quantity control, and aesthetics. In fact, the median increase in priority ecosystem services was 28 percentage points as compared to 6 percentage points for all other services. More importantly, however, the process provided a learning opportunity by identifying services that performed worse than expected (e.g., water filtration) or better than expected (e.g., air quality nitrogen removal) under the design scenarios. The process of developing the ER and ER+ designs and the iterative process of refining the details to enhance the ecosystem services took the project team approximately three to four months. This timeframe is not different than what would have been required for design and engineering of the cap in the SBR option. By examining how the ecosystem services are produced across the site, users can better understand the links between specific design features and the production of services, and consider how to improve performance. Sharing these data with the wetland designers allowed them to incorporate the most impactful elements in the final design.
Adding a layer of discussion around ecosystem services between the project team and Nature Team was key in defining alternative solutions. A site visit between an expert panel with the ESII Tool at hand to collect ecological data while building alternative design scenarios allowed the team to integrate nature based solutions within the existing business process decision (including ENT such as wetlands). The quantification of the ecosystem services for the baseline case was a key step in setting the standard for the project team – the solution needed to deliver a higher level of overall performance than what was there today.
3.3. Consider and compare
Ecological restoration (in ER or ER+) on the ash pond is estimated to avoid $1.8 to $2.0 million (net present value over 10 years) in costs to Dow as compared to the SBR design. Note that ecological restoration for Dow is the same under ER and ER+. The difference in these costs primarily reflects the higher costs of capping the area and long-term maintenance costs (including groundwater monitoring and treatment) associated with SBR. Groundwater treatment is not required with the ER and ER+ since contaminants of concern will have been removed from the site. In contrast, the cost of planting grass in SBR is less expensive than planting trees, prairie, and wetland plants for ecological restoration. However, this cost savings is not enough to offset the higher costs of capping and maintaining the site in the SBR design. Mowing and grounds maintenance costs are lower in ER or ER+ than in the SBR design because the natural habitats only require annual mowing in some areas and invasive species management in the first few years. Although not accounted for here, it is possible that the enhanced stormwater control provided by the ER design could also reduce damage to non-Dow property downstream from the site.
Ecological restoration on the 4-D property is $1.1 to $1.2 million (net present value over 10 years) more expensive than the SBR design. Note that ecological restoration only occurs on the 4-D property under ER+. Although not a cost savings option for the City of Midland, the ecological restoration of the property would provide many community benefits, including the restoration of one mile of riverfront across from Downtown Midland, an important connection to a vast network of parks, open spaces and trails, improved aesthetics at an important city gateway, and a natural recreational area within walking distance of Downtown Midland.
The ER+ design also may provide additional benefits. For example, under the US Federal Emergency Management Agency's Community Rating System, municipalities may seek credits for increasing open space. If granted, these credits would reduce flood insurance rates. The open space would also provide recreational opportunities and improve aesthetics for citizens and visitors to the City of Midland. In addition, it is possible that natural habitats may improve water quality and air quality, thus improving the quality of life for people in Midland.
4. Conclusions
The sooner the application of natural solutions is considered in the design and planning of capital expenditure projects, the more easily and cost-effectively they can be integrated into the core of the project design. The nature valuation methodology has been tested on multiple projects and at multiple sites and refined as part of Dow and the Conservancy's collaboration, along with the help of ESG. The creation of the three-step process along with the addition of very specific tools to Dow's engineering tool box, such as the ESII Tool, to quantify ecosystem services has enhanced Dow's project designs, allowing Dow to reach its first yearly milestone within the Valuing Nature Goal.
The extra work by the project team with filling out of the initial screen, engaging with the Nature Team and using the ESII Tool to define project alternatives proved to be time well spent in terms of both business value and enhancement of ecosystem services. The conversion of the ash pond into Dow's Riverside Wetlands demonstrates that Dow considers nature in decision making in a way that has never been done before. It aligns with Dow's 2025 Sustainability Goals, specifically the Valuing Nature Goal, and demonstrates that decisions that improve nature and business value (including ENT, process improvement, enhancement or management of nature on site, and nature-leveraged commercial opportunities) can be undertaken to reduce long-term costs and maintenance for Dow's manufacturing sites.
The Dow Riverside Wetlands will ultimately establish a 23-acre conservation wetland that adds recreational amenities to the City of Midland, while improving nearly one mile of riverfront across from the downtown area. The restoration of the former ash pond site to a wetland improves important ecological functions in the area while improving natural habitat through the reintroduction of over 25,000 plants, including 60 species of trees, shrubs, grasses and other native plants. The natural diversity of the project area supports biodiversity, improves water and air quality, and creates an important connection to a vast network of parks, open spaces and trails in the Midland area.
Water quantity control has, to date, been the most evident and obvious ecosystem service that Dow's Riverside Wetlands provide. Visible from Dow's East End offices across the river, the Riverside Wetlands' water quantity control ecosystem service functions have been ahead of schedule. Initially, the project team thought the site would be fully functional and retain floodwater only when all of the plants were mature. Yet, twice in the past year, the project site has flooded and reduced flooding impacts downstream. The water retention of the project area has provided senior leaders with a visual representation of the ecosystem services that Dow's Riverside Wetlands provide for the site and town and serves as a successful example of ENT.
New approaches to old problems require data. The business-as-usual approach to restoring the ash pond would be a traditional cap. Multi-stakeholder engagement was facilitated by ecosystem service quantification, which allowed all the stakeholders to reach a common understanding, allowing the project team to make a case for selecting the ecological restoration alternative. By utilizing a new tool to provide ecosystem service data in engineering terms, Dow and the Conservancy were able to work with the Michigan Department of Environmental Quality, the City of Midland, and senior decision makers within Dow to instead create a functional, ecologically diverse wetlands area.
Acknowledgements
We gratefully acknowledge help and insights from the rest of the project team including: Martin Crook and Christian Lynn at AECOM; Steve Lucas at Dow; Michelle Halsey, Jim Koloszar, and Morgan Erhardt at EcoMetrix Solutions Group; and Chris May, Sheila M. W. Reddy, Jim South, and Jen Molnar at The Nature Conservancy. All omissions and errors remain our own.
References
Christensen et al., 1996 Norman L. Christensen, et al. The report of the Ecological Society of America Committee on the Scientific Basis for ecosystem management Ecol. Appl., 6 (3) (1996), pp. 665-691DiMuro et al., 2014 Jonathan L. DiMuro, France M. Guertin, Rich K. Helling, Jessica L. Perkins, Scanlon Romer A financial analysis of constructed wetlands for industrial wastewater treatment J. Ind. Ecol., 18 (5) (2014), pp. 631-640
Preston, 1962 F.W. Preston The canonical distribution of commonness and rarity: part I Ecology, 43 (2) (1962), pp. 152-215
The Millenium Ecosystem Assessment, 2005 The Millenium Ecosystem Assessment Ecosystems and Human Well-being: Synthesis Island Press, Washington, DC (2005) http://www.millenniumassessment.org/documents/document.356.aspx.pdf, Accessed 27th Feb 2018
The President's Council on Sustainable Development, 1999 The President's Council on Sustainable Development Advancing prosperity, opportunity, and a healthy environment for the 21st century http://www.globalurban.org/Towards_a_Sustainable_America.pdf (May 1999), Accessed 27th Feb 2018 1 For more information on the ESII Tool, see: http://www.esiitool.com/. 2 In the first half of 2014, Dow and The Nature Conservancy staff held webinars with 25 people from across the company to identify priority ecosystem services that were based on 54 actionable decisions.
View Abstract
