“Nobody reads the sustainability reports and websites that we spend so much time and expense preparing,” companies complain (somewhat hyperbolically). Stakeholders who rely on this information from companies bemoan the increasing barrage of data that lacks the necessary context to assess its relevance and validity. Enter ContextReporting, a free sustainability data visualization and benchmarking app, to fill this gap.
ContextReporting is designed around Global Reporting Initiative indicators in the environmental, social and governance (ESG) realms. So you can dive deep into key performance indicators (KPIs) such as total water use (E), product responsibility and human rights (S), and board structure (G).
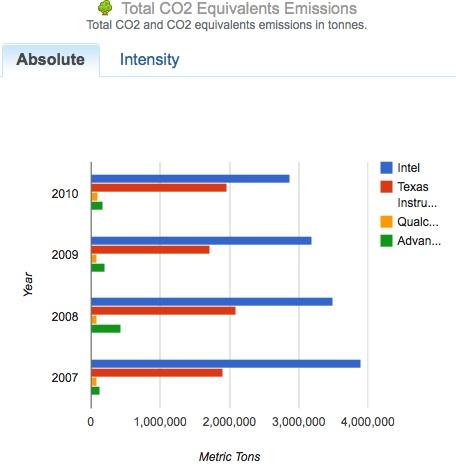
Let’s say, for example, you’re wondering about the carbon emissions of the semiconductor industry. Just click the first listed profile, Advanced Micro Devices, then under “Emissions Reduction” click “Total CO2 Equivalent Emissions,” and Voilà! — up pops a chart of performance from 2007 to 2010, showing AMD’s emissions going way up in 2008, then back down through 2010.