Patrick O'Connell, CFA| Director—Fixed Income Responsible Investing Research

As global warming worries approach critical mass, corporate bond investors expect issuers to be part of the solution. At the epicenter of the climate crisis are greenhouse gases (GHG), which all industries emit in one way or another. Many companies strive to shrink their emissions, or carbon footprint. But a carbon handprint measures the positive impact, or carbon avoided, by the use of a company’s products or services.
Carbon Handprint Measures Positive Climate Contribution
The planet has nine years to improve carbon emissions trajectories and avoid catastrophe, according to a study released at the recent UN COP27 climate conference. Global warming experts at COP27 said that reducing carbon output alone is now insufficient to hit long-term net zero1 goals. More and novel approaches are critically needed, especially prevention.
To understand how carbon emissions prevention and avoidance works in industries, investors should look to carbon handprint. Carbon footprint measures GHGs produced from a company’s activities across its operations and third parties.2 By contrast, carbon handprint measures the emissions avoided by other companies that purchase and use products and services that represent the positive solutions to global climate challenges.
From clean energy to recycling, transportation to energy efficiency, diverse companies with a big carbon handprint are making major contributions to solving the world’s climate crisis. An in-depth study conducted by our equity colleagues shows how companies with carbon handprints that outweigh their carbon footprints—the emissions generated by manufacturing their products—offer powerful solutions to the world’s climate challenges.
Carbon handprint adds a new dimension to climate-aware fixed-income investing. It’s another yardstick of an issuer’s positive contribution to a better environment. It also strengthens the framework around standards that managers use to score certain ESG-labeled issues, especially green bonds. And with a more accurate picture of a green bond’s potential, managers can weigh the worth of its greenium, the negative yield between a company’s green and conventional issues.
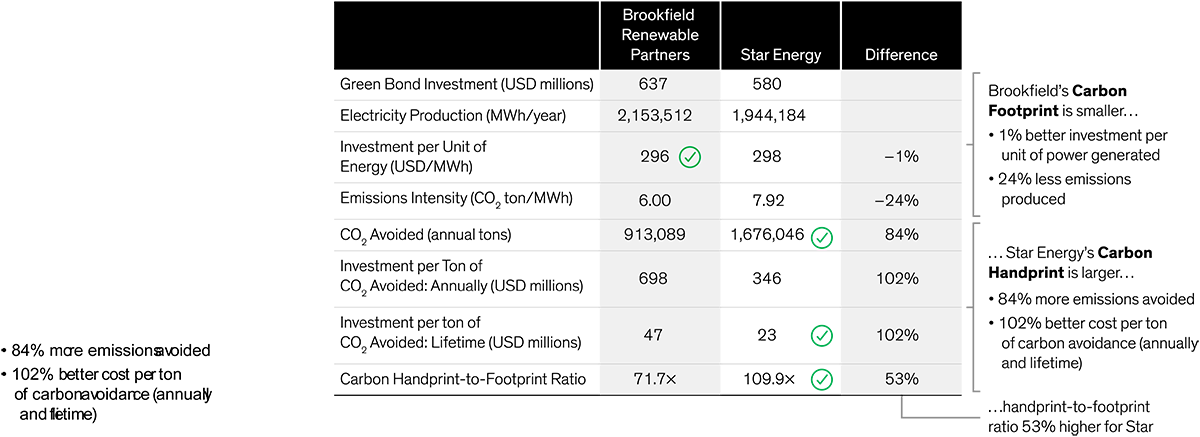
Assets Everywhere Can Be Gauged Using Carbon Handprints
Although carbon handprint is still underappreciated, we find what it says about a firm’s GHG output useful across the fixed-income spectrum. There are different ways to quantify a carbon handprint for different types of climate solutions. But the unifying principle that anchors our analysis is how much carbon is avoided. This metric becomes the lens for identifying and evaluating a carbon handprint. For example, clean energy companies will be judged on the amount of zero-carbon energy generated, while resource efficiency companies are ranked on their ability to save energy for other companies and entities.
Handprints can stem from major construction of a new green-certified factory, the simple installation of energy-efficient lighting and so much in between. AB believes that solar and wind power, thermal insulation and electric vehicles (EVs) will have the most impact on GHG avoidance by 2030—in other words, the largest carbon handprints.
Carbon handprint is expressed in metric tons of CO2 prevented or avoided, so it reveals whether an issuer produces more carbon than it prevents. For example, each metric ton of CO2 that a thermal-insulation maker emits during production results in 200 metric tons of avoided carbon output for its customers, an impressive 200:1 handprint-to-footprint ratio. Ratios can vary widely, especially across company types but also within sectors. So, a firm’s relatively small differences in handprint-to-footprint ratio can still reflect a big contribution to carbon avoidance within its industry.
Handprints Can Be Evaluated Based on Economics
Our research also shows that the cost to reduce or avoid carbon emissions varies widely by product and industry. For example, in commercial jetliner production, carbon fiber is by far the cheapest material to implement, primarily because it’s so widely used for its superior strength and energy-saving lighter weight. Meanwhile, biofuels and cold storage are currently much less economical paths to increase carbon handprints. However, with future innovations likely, we think their costs will drop over the next decade, along with the costs of electric-vehicle adoption and green construction materials, which are currently high but may decline.
The costs of carbon reduction have wide implications for fixed-income research, and not just in carbon-intensive sectors. Firms in all industries may want to improve their carbon handprints, but implementation costs matter. Companies tend to lean toward more cost-effective carbon handprint solutions such as LED lighting, thermal insulation and carbon fiber. We believe AB’s cost research helps identify the businesses that stand to benefit from the demand.
Handprint Completes the Story When Comparing Bonds
As a comparative tool, carbon handprint can broaden a climate-aware bond investor’s perspective when screening for opportunities, especially among green bonds, which mandate a materially more detailed disclosure that helps investors compare carbon footprints and handprints more granularly. For instance, Brookfield Renewable Partners and Star Energy are two relatively similar issuers, both with highly credible green bond frameworks and environmentally friendly assets. They’re both renewable electricity providers and advocates for climate improvement. But a two-tier analysis shows that one has a greater carbon handprint.
Based on Brookfield’s green bond proceeds and annual output, its investment per unit of energy produced is slightly cheaper than Star Energy’s, and its emissions (carbon footprint) are a respectable 24% lower.
Diving a little deeper, however, Star Energy has the bigger handprint, including over 700,000 more metric tons of avoided CO2 output per year, which it reached at almost half the cost per ton compared with Brookfield. This nets it an impressive 110:1 handprint-to-footprint ratio.
We’ve come far to bring nations together toward common climate goals, but the general takeaway from COP27 is that global warming remains an urgent threat. If economies are to prosper, companies will need to do their part.
We believe that spending on decarbonization technologies will need to exponentially grow in the next decade to hit corporate net zero targets on time. This massive spending will favor companies that provide decarbonization solutions that not only lower emissions internally, but also avoid them across the entire value chain, offering attractive investment opportunities for fixed-income investors.
This article relies heavily on the invaluable and original research published by David Wheeler, CFA, Portfolio Manager—Sustainable Climate Solutions and Senior Research Analyst—Sustainable Thematic Equities, in his recent white paper, Carbon Handprints: A New Approach to Climate-Focused Equity Investing.
1. A net-zero carbon economy is defined as an economy that aligns with 1.5 degrees Celsius of warming by 2050 as outlined by the Paris Agreement.
2. Carbon footprint: Weighted average carbon intensity
The views expressed herein do not constitute research, investment advice or trade recommendations and do not necessarily represent the views of all AB portfolio-management teams and are subject to revision over time.
References to specific securities are presented to illustrate the application of our investment philosophy only and are not to be considered recommendations by AB. The specific securities identified and described do not represent all of the securities purchased, sold or recommended for the portfolio, and it should not be assumed that investments in the securities identified were or will be profitable.